Arden Davis

Interactive Designer + Developer
Basketball Evolution
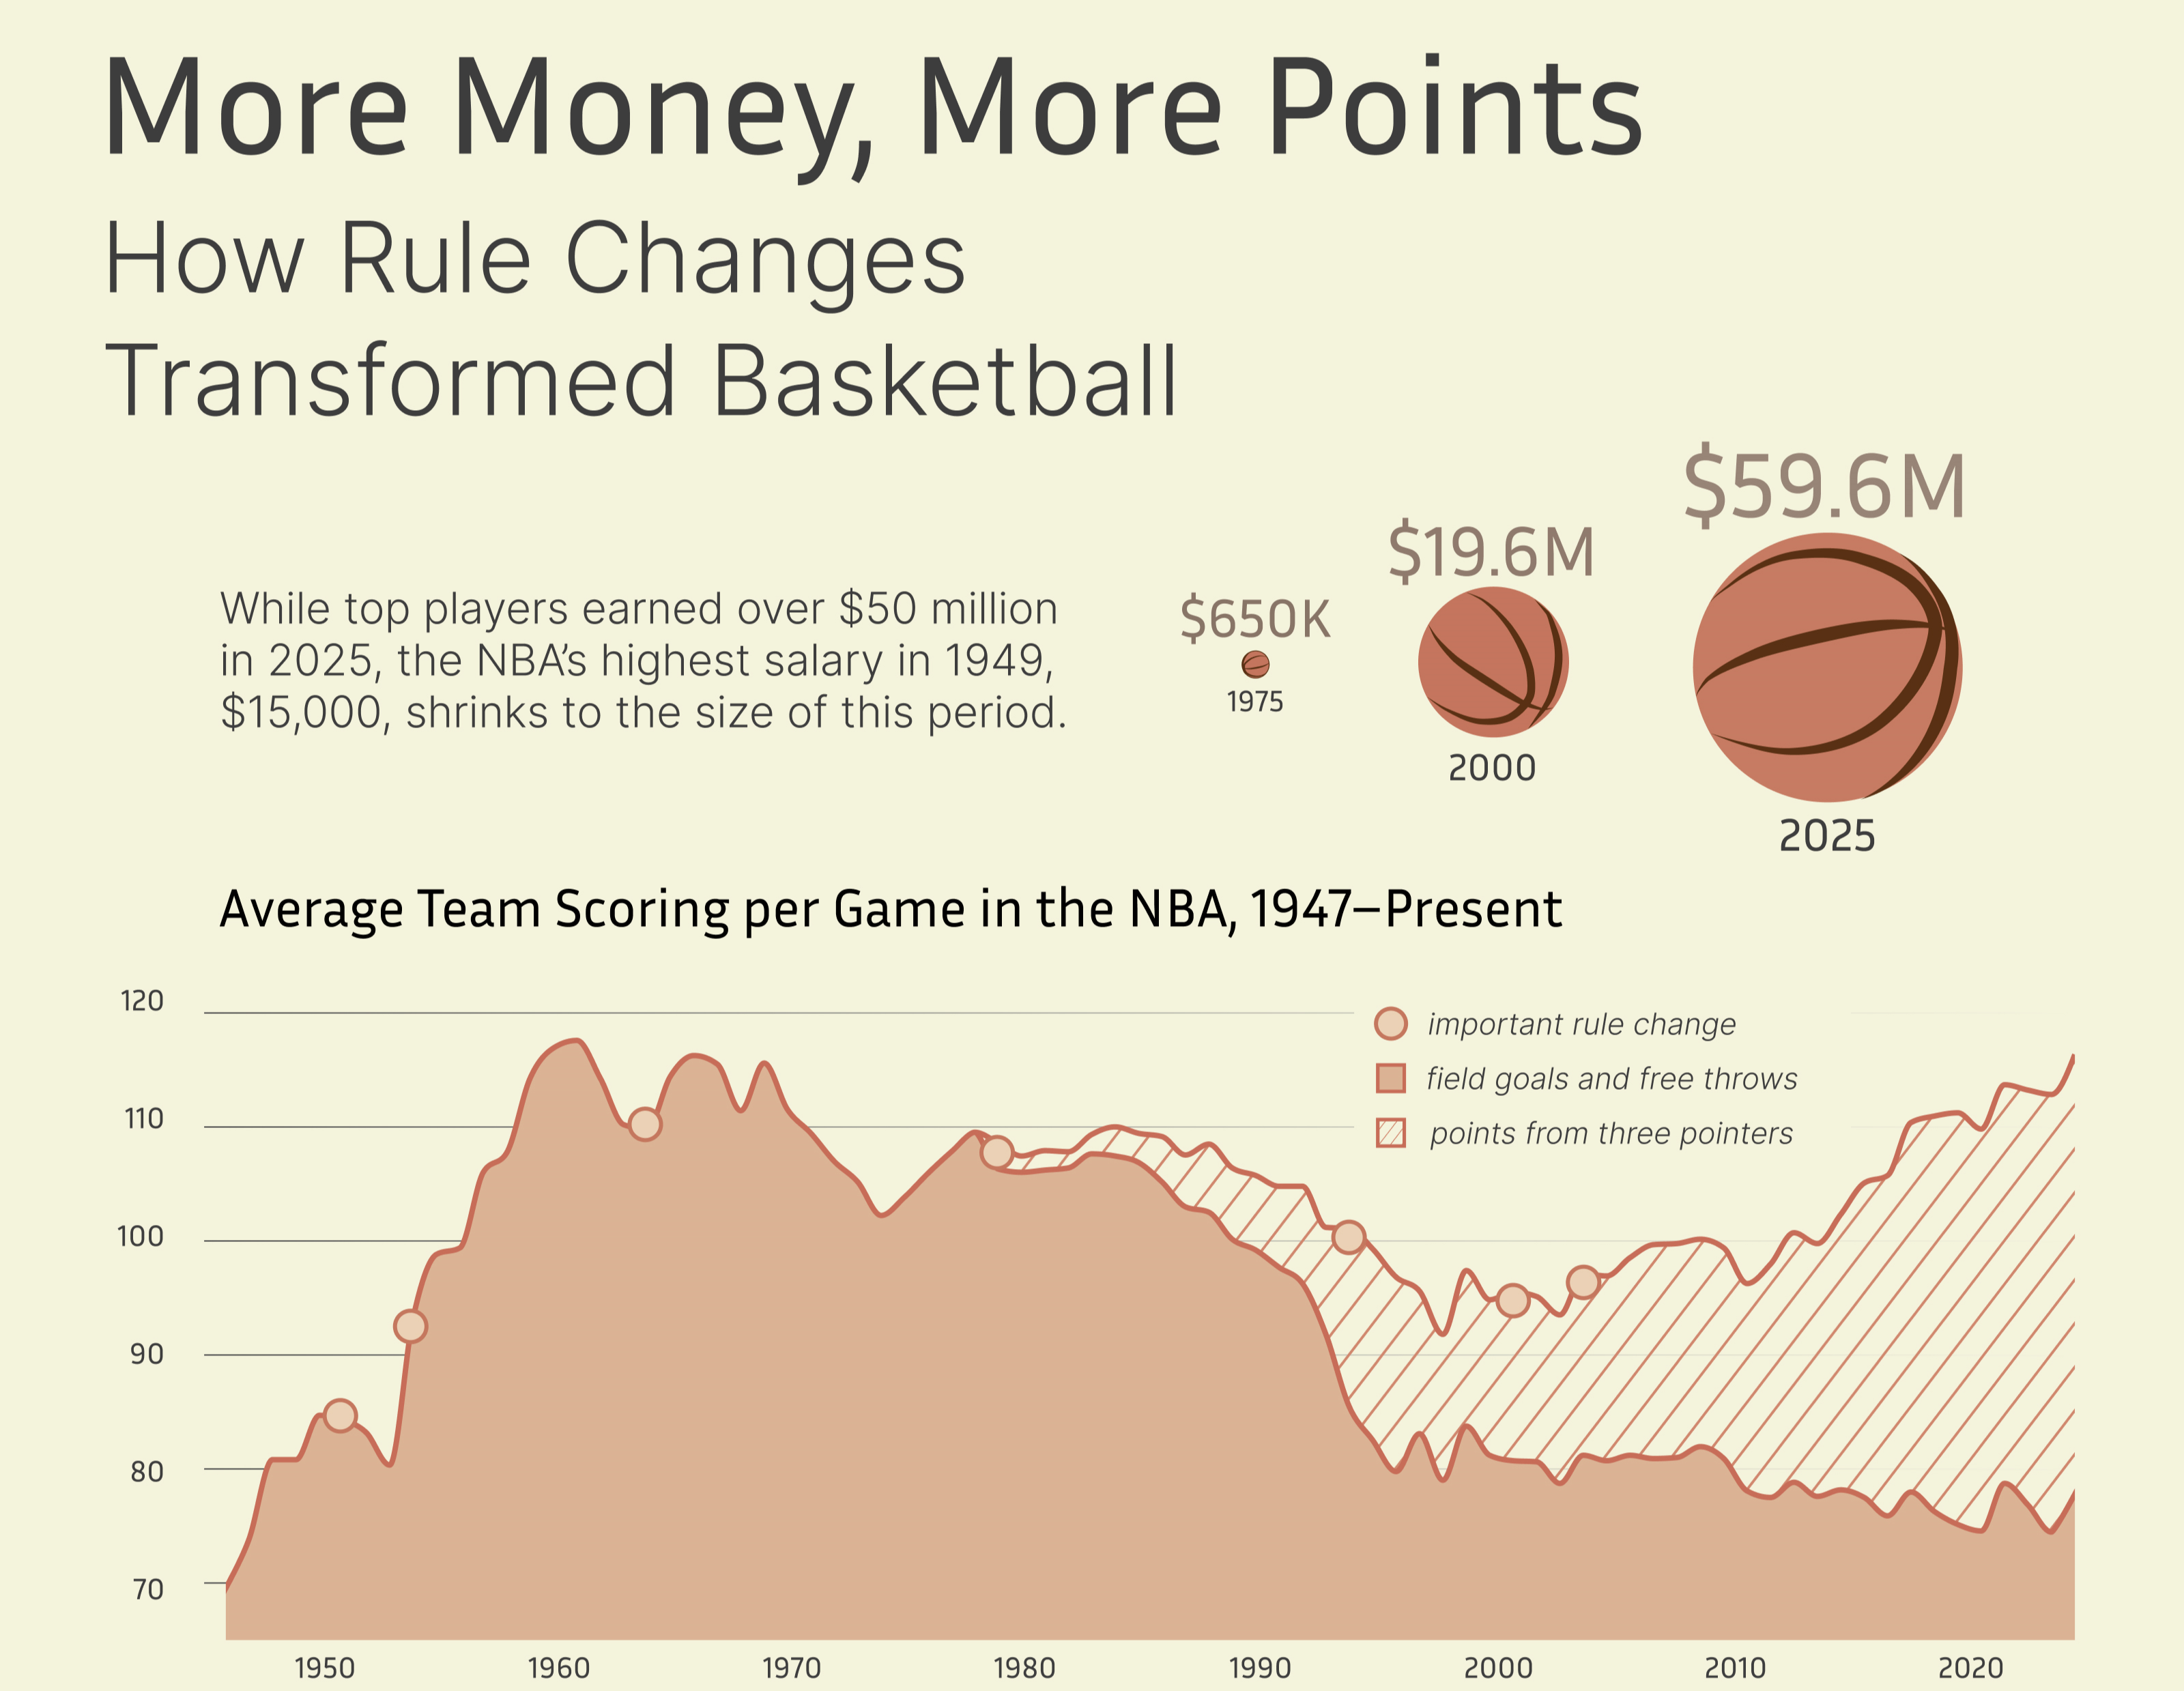
Deeply reseached infographic highlighting major rule changes in NBA history and their effects on the game.
Technologies: Figma, D3.js, Python
60 Years of Love
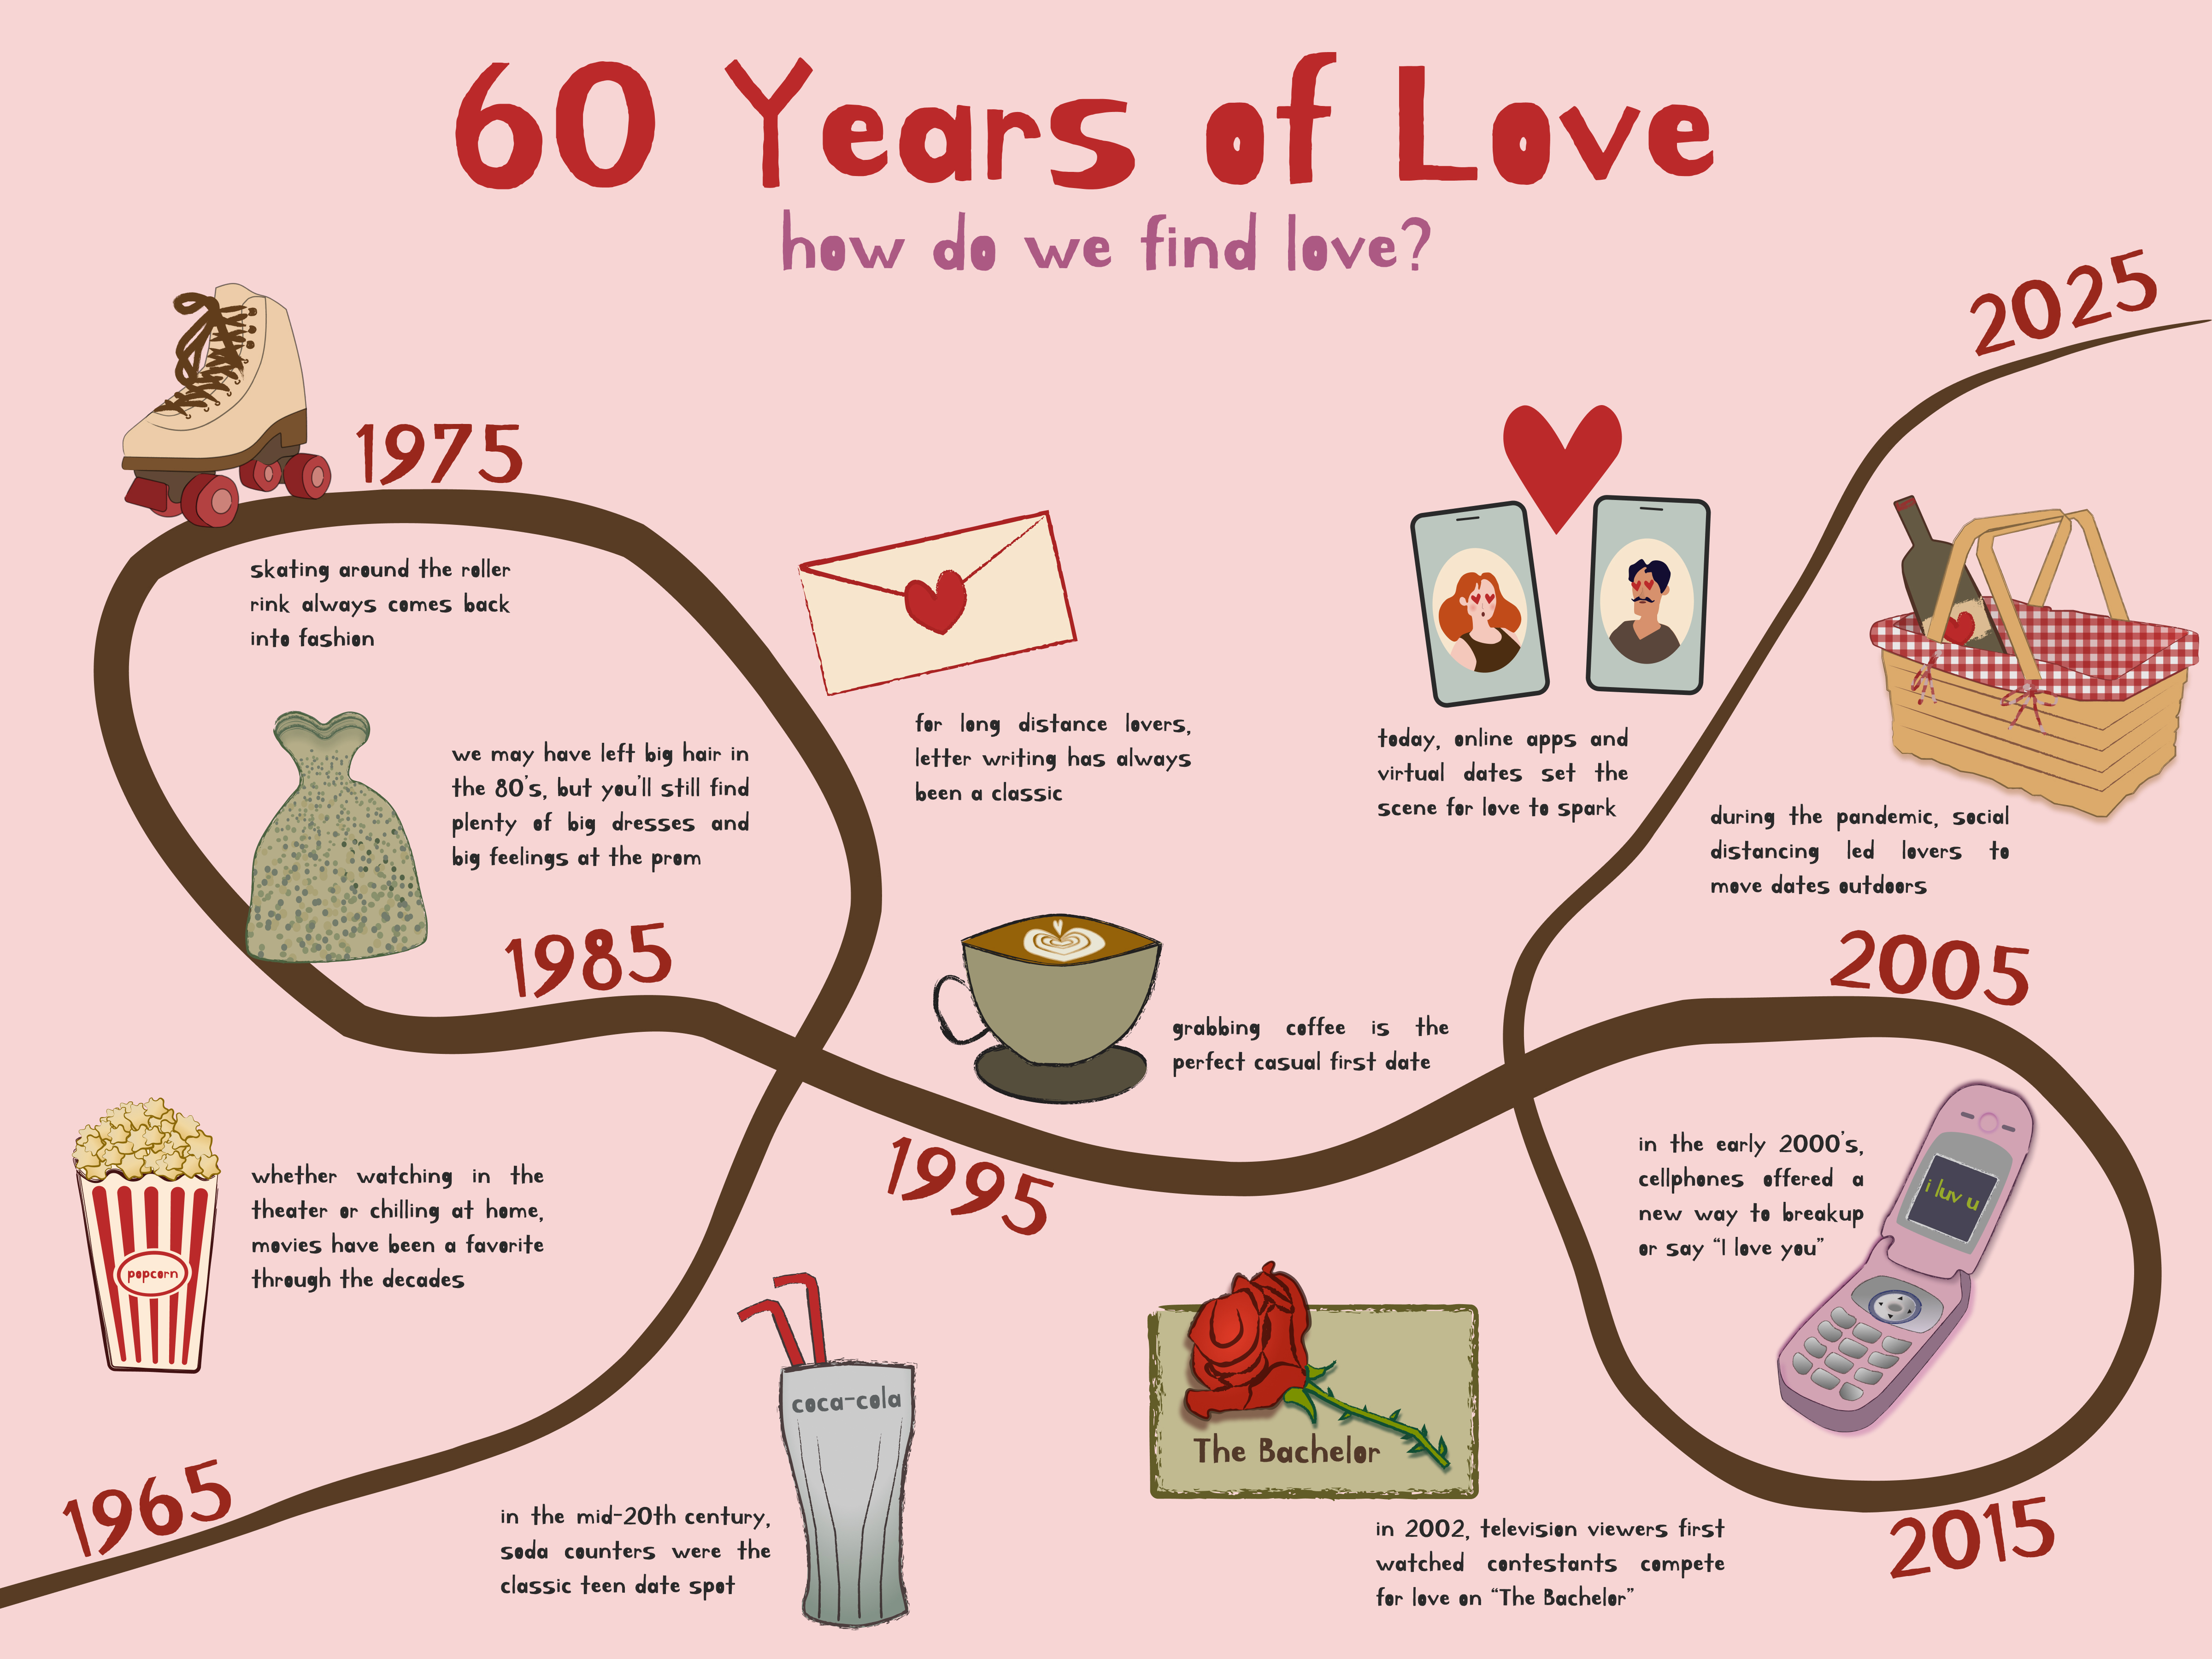
Infographic exploring the ways dating has changed since 1960.
Technologies: Figma
US Energy Trends
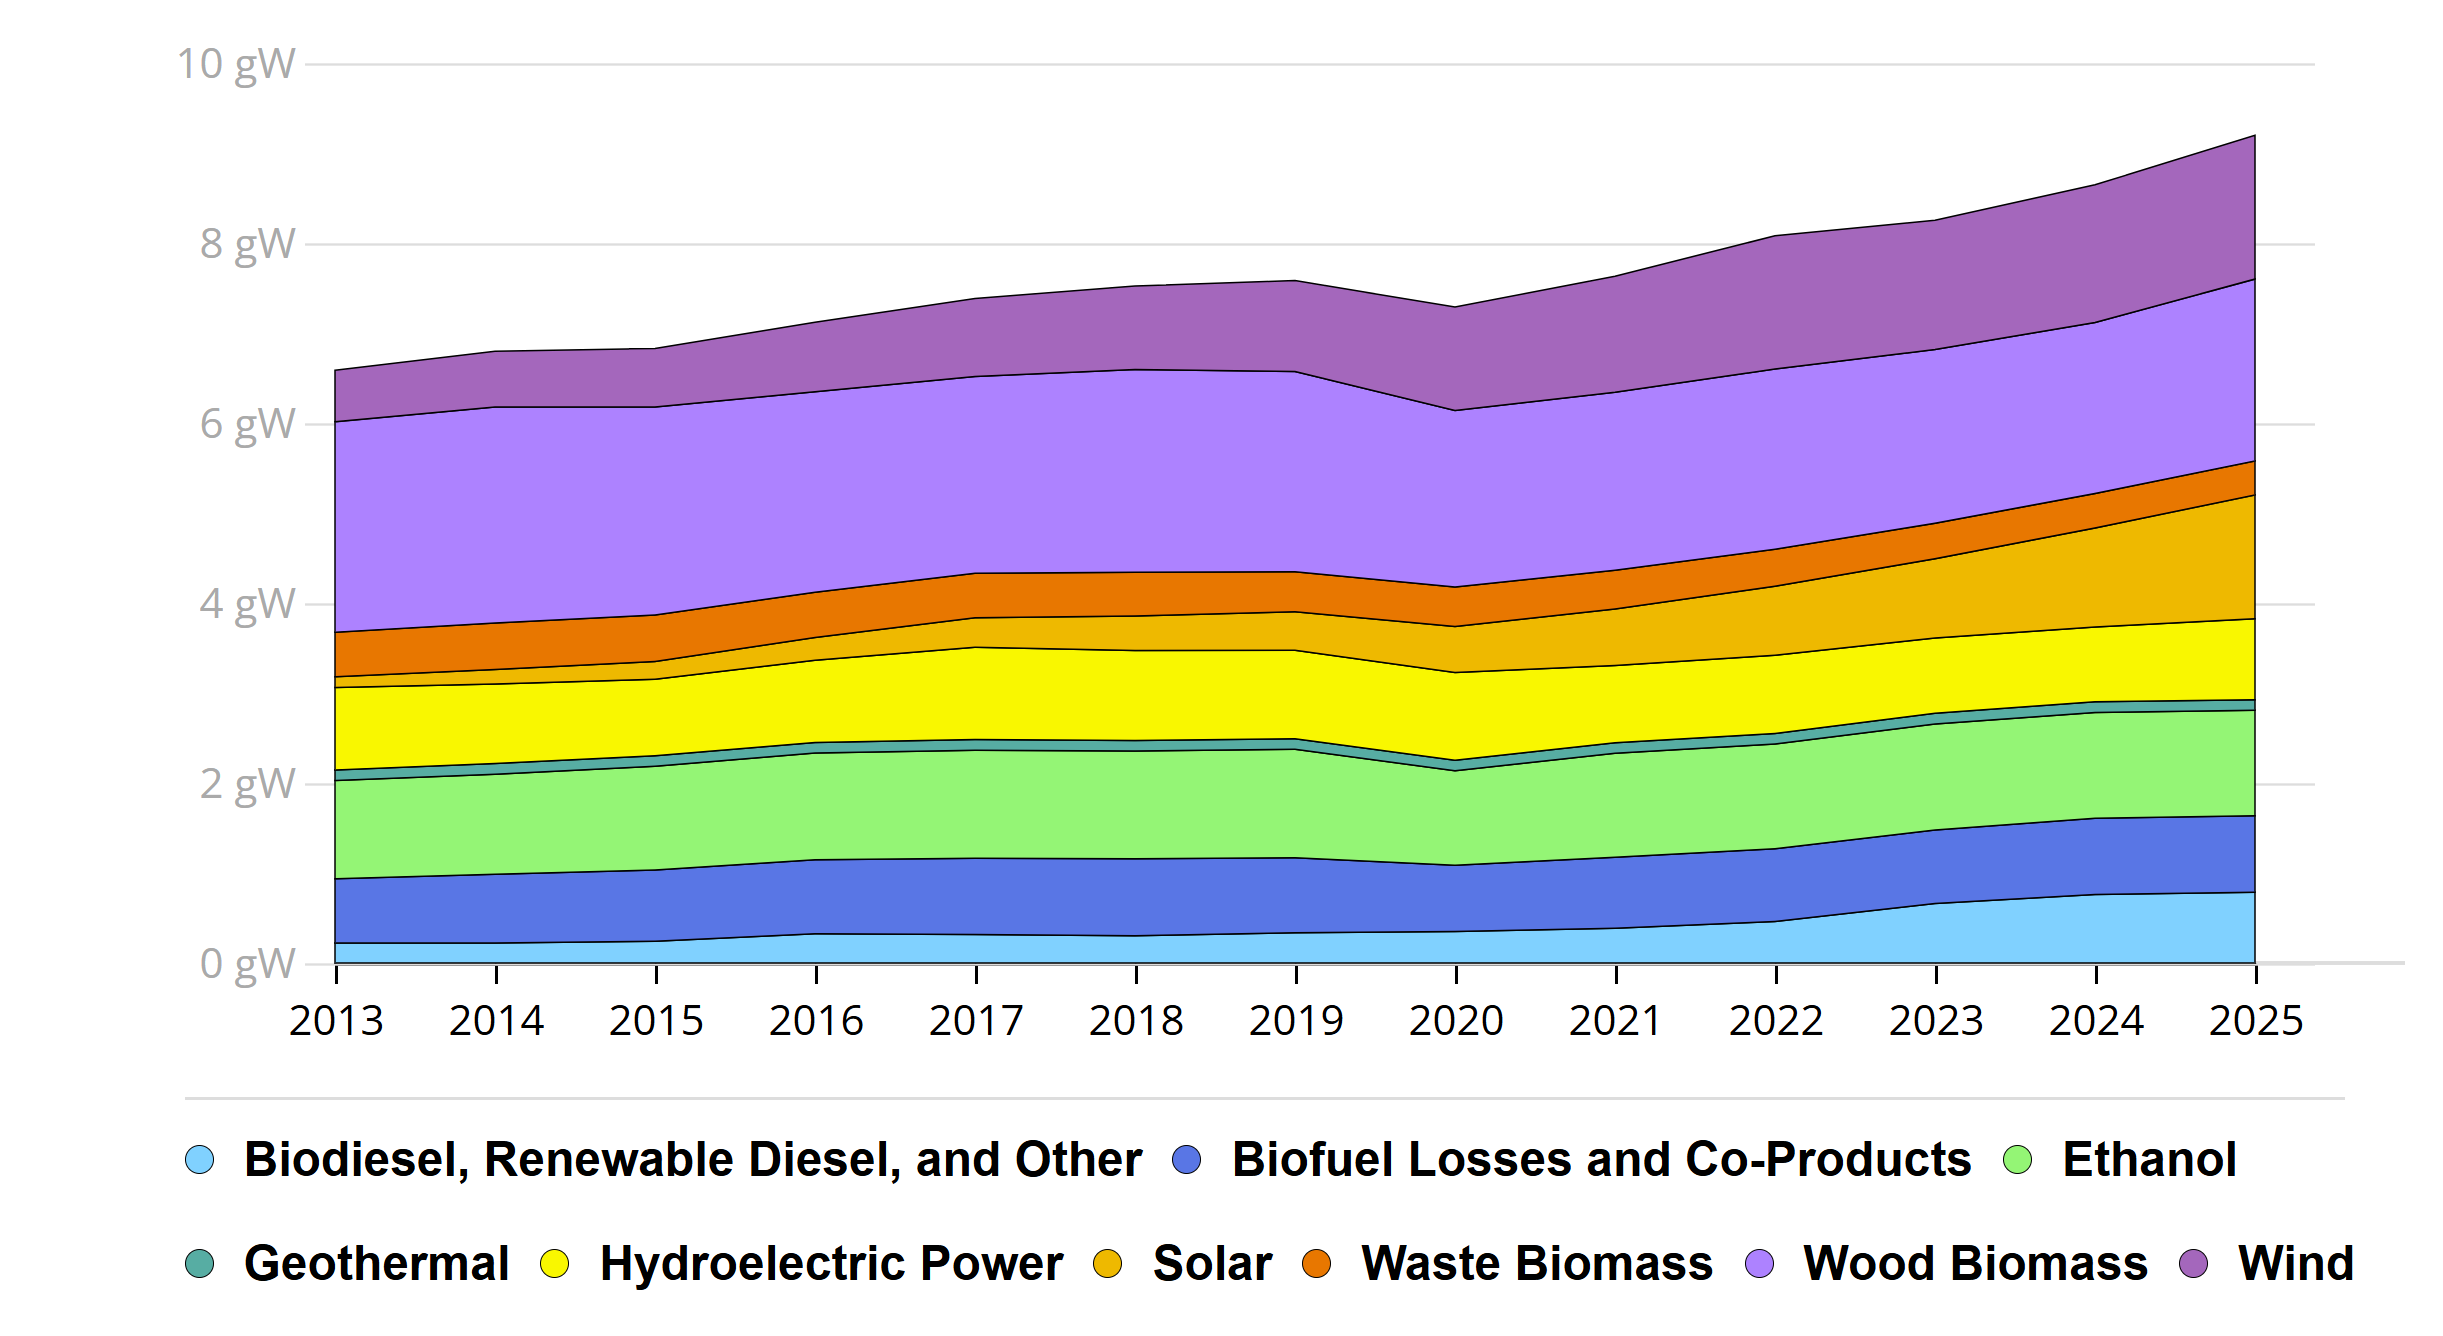
Data Journalism piece with interactive graphics exploring trends in energy demand and renewable sources.
Technologies: HTML, CSS, JS, D3.js, Google Sheets, Figma
CharliVis

Dove into my affintity for CharliXCX's music with a series of D3.js data visualizations that explore her self titled album.
Technologies: HTML, CSS, JS, D3.js, Python, Beautiful Soup, Genius API, Spotify API, Figma
Caffeine & Mood Study

Exploring the connection between mood and caffeine intake using data visualization and a tactile element.
Technologies: Tableau, FIgma
Music Infographic (Data Redesign)
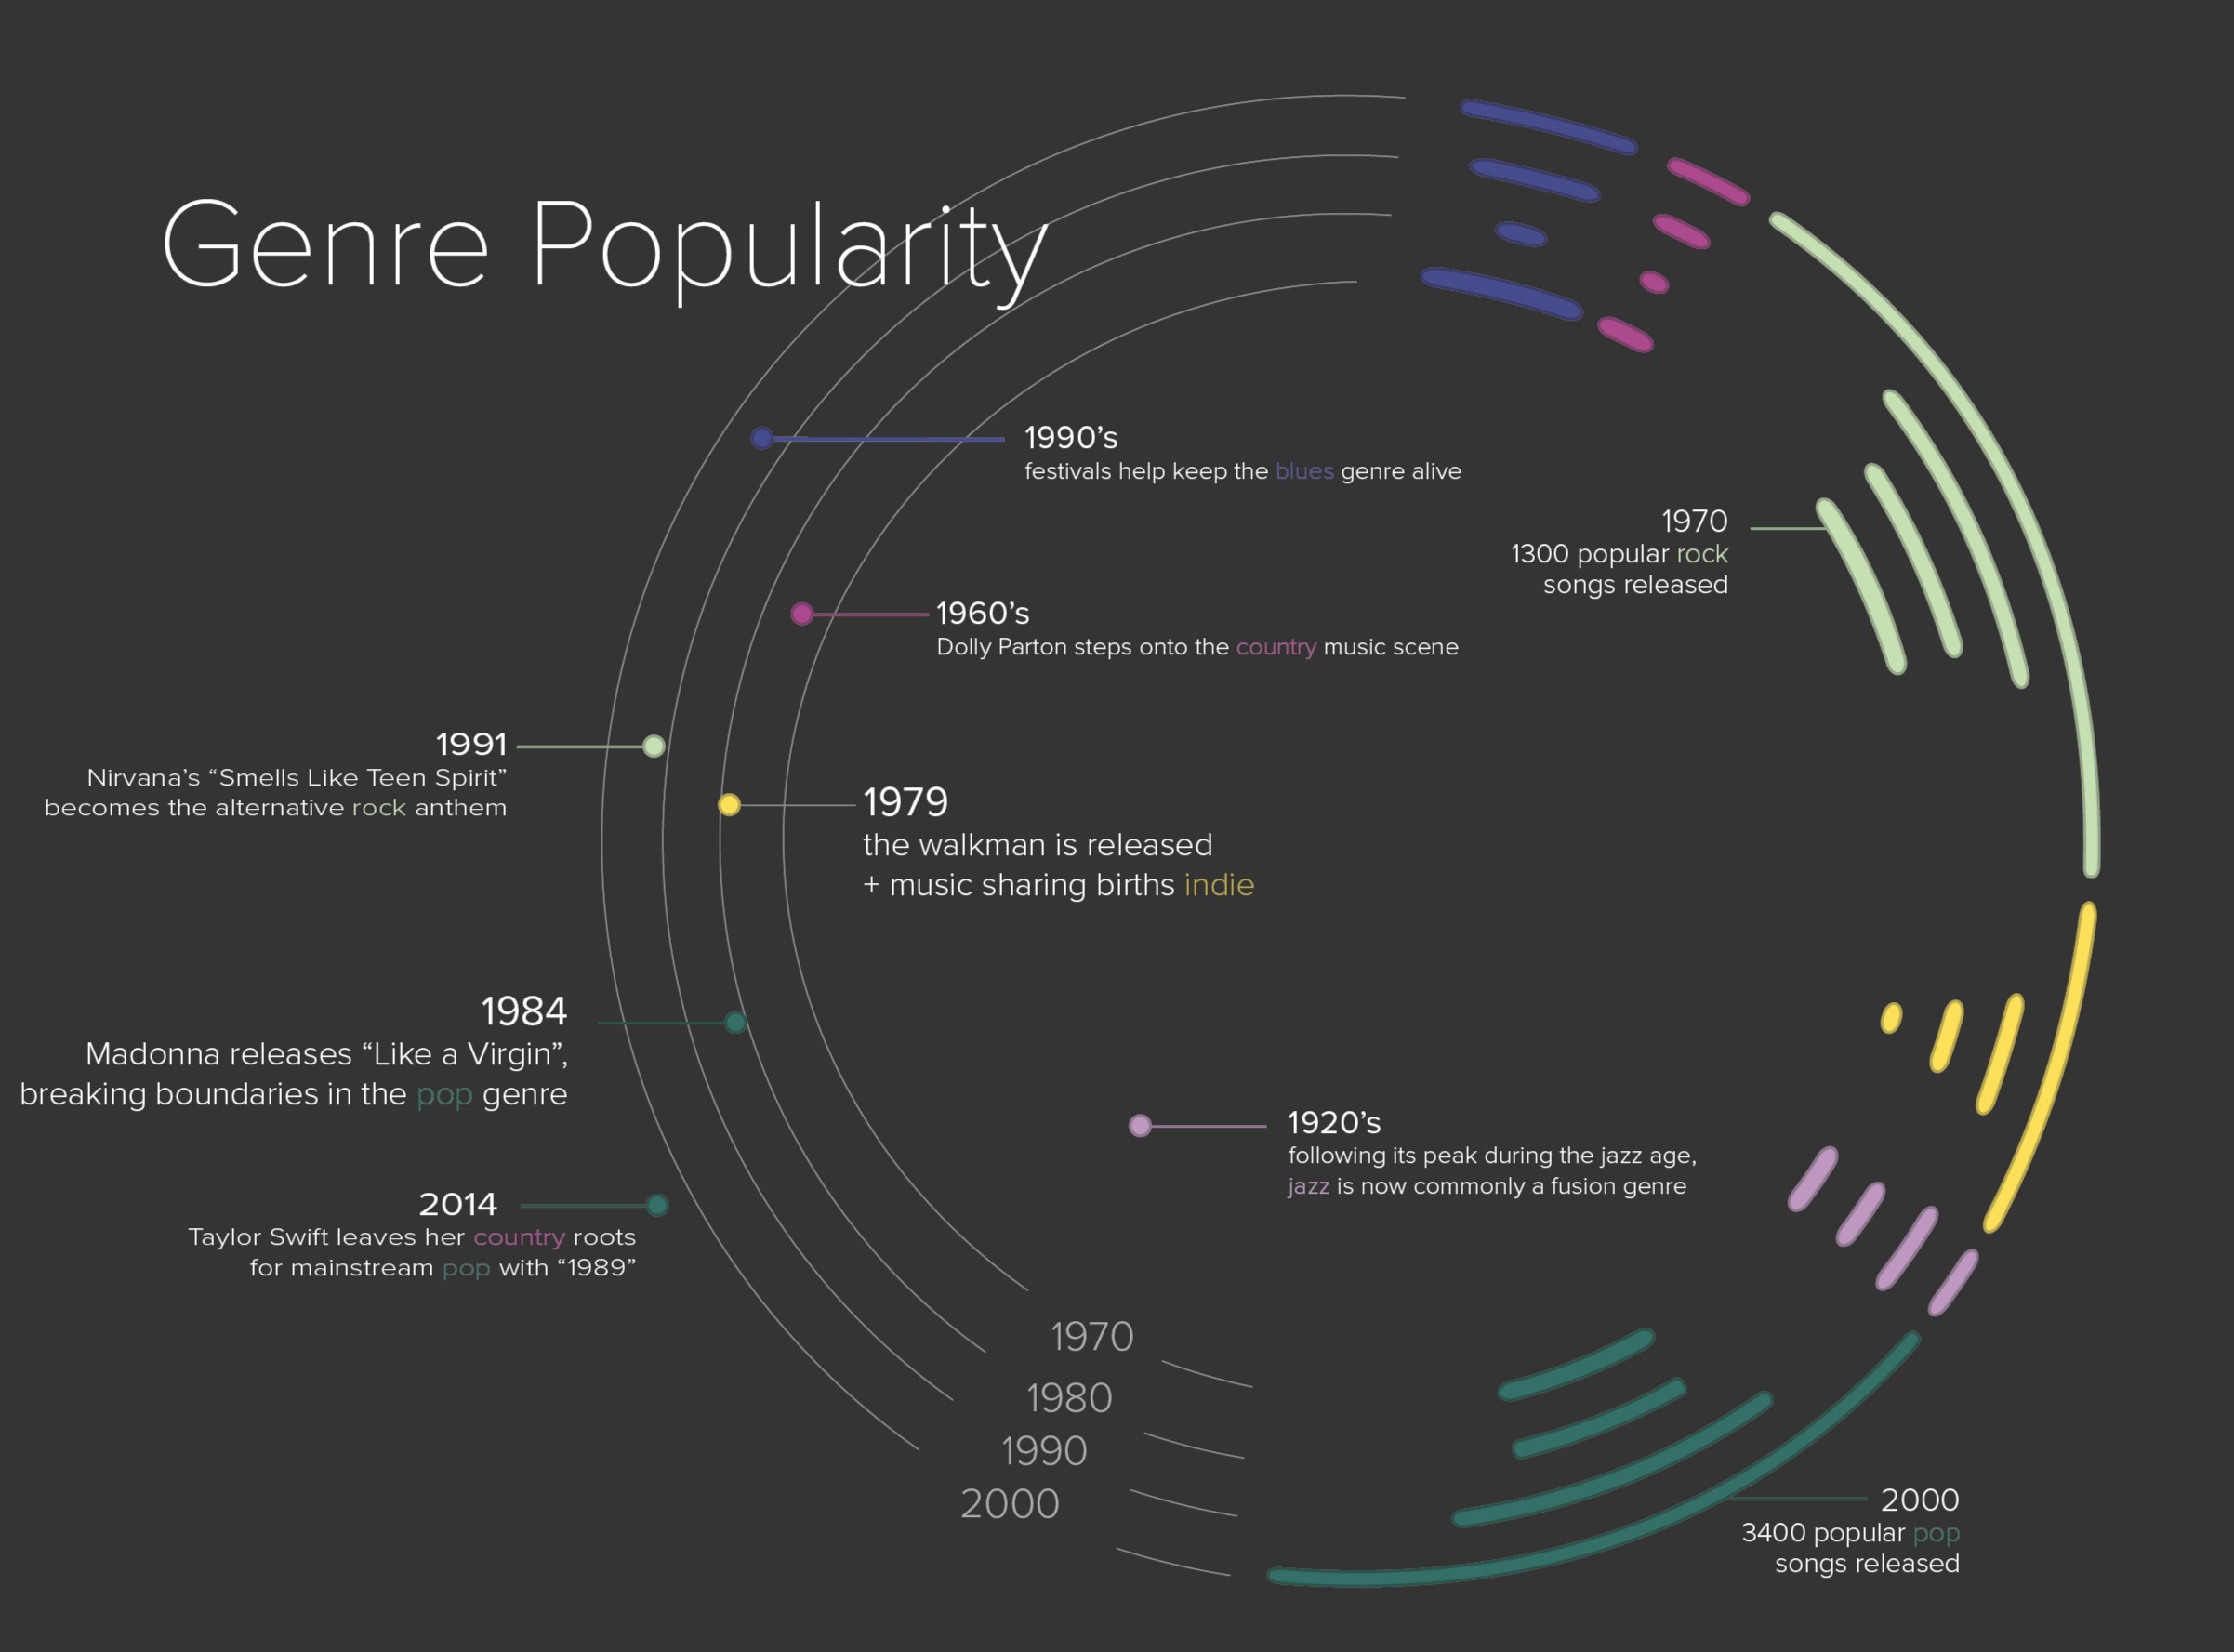
Recontextualized genre data by turning a simple line chart into an infographic.
Technologies: Adobe Illustrator
Tulum Travels

Created maps using open source data for an information design course.
Technologies: Adobe Illustrator