Arden Davis

Interactive Designer + Developer
Basketball Evolution
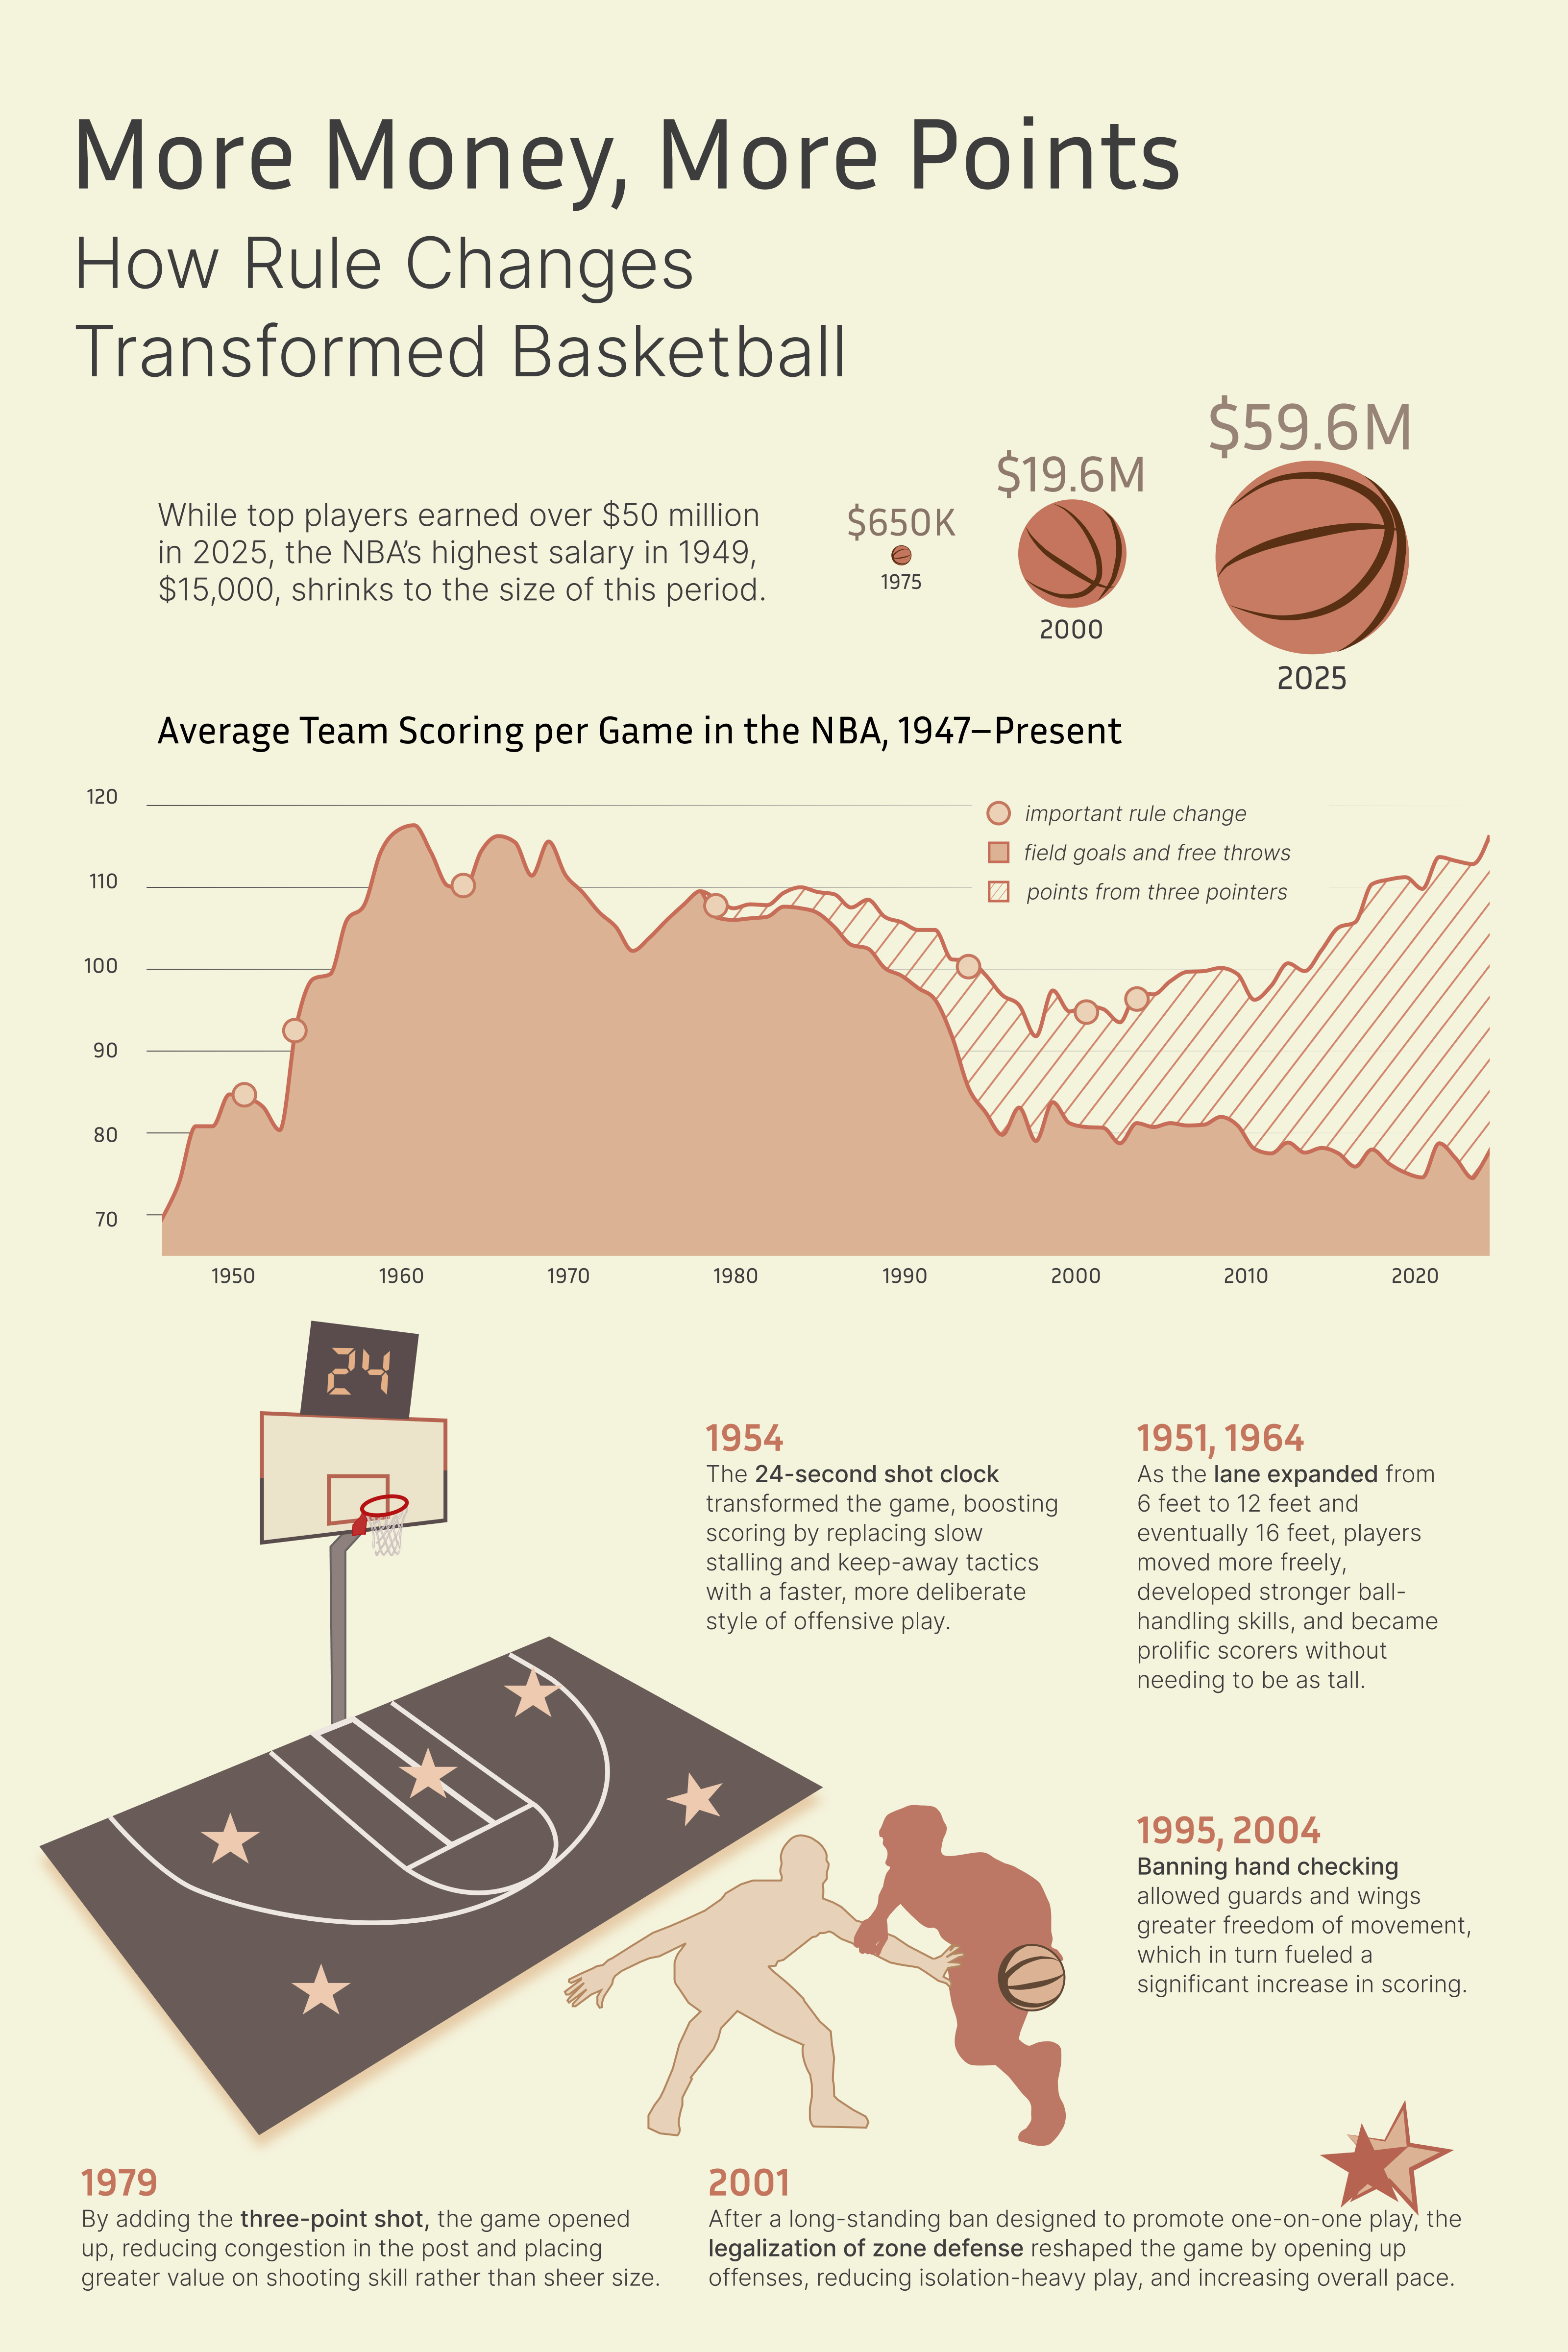
Infographic depicting NBA history told through rule changes.
As part of a commision for a retirement gift, I explored major rule changes in the NBA. This included establishing a working knowledge on the history of basketball, identifying scholarly sources which expanded on the impact of certain rule changes, and finding and shaping datasets to illustrate the effect of these changes.
In order to explore the data and its shapes, I used D3 to form interactive graphs. They were used both to ideate on chart types and ways to combine data, as well as to identify trends in the years surroundings major rule changes. I was later able to export these designs as SVGs to farther customize within figma.
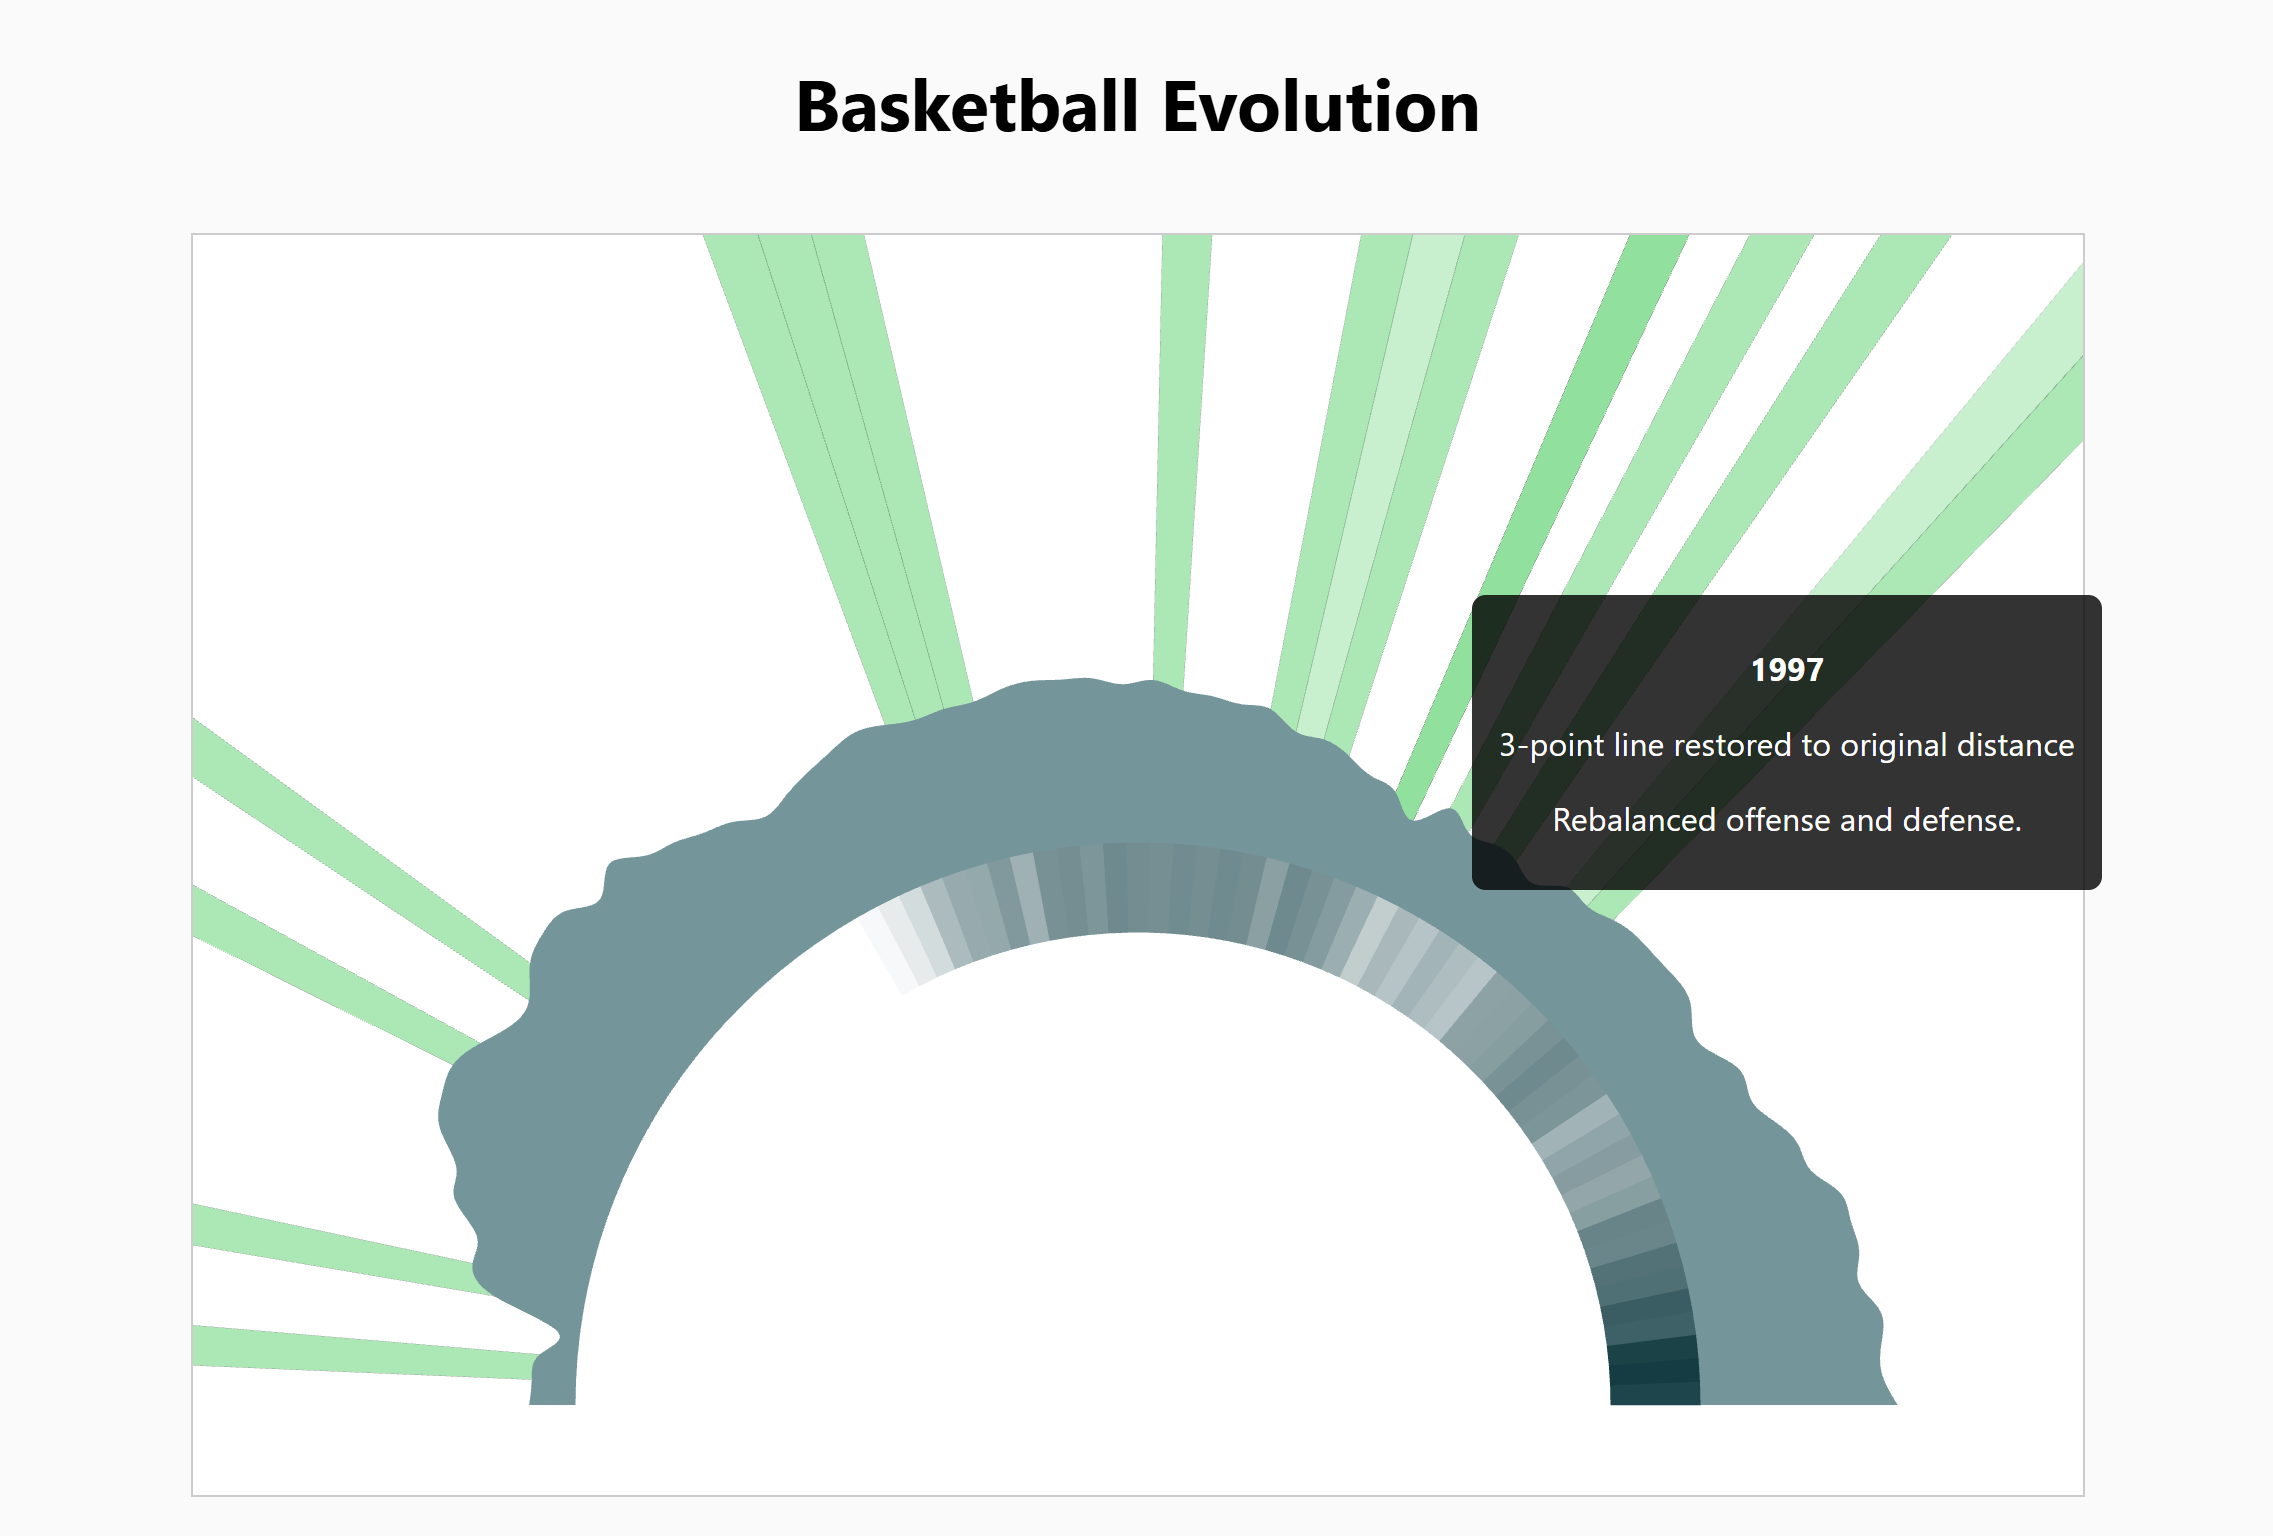
These basic charts are interactive and can be explored here.